A landing page conversion rate is the share of visitors who did the one thing the page asked. It is the number everyone wants to compare and the number that is easiest to misread. This post explains how to calculate it, what the best-known benchmark actually says, why a median can mislead you, how to measure your own rate on Vonza, and the changes that move it.
The calculation
Conversion rate = conversions ÷ unique visitors × 100, over the same period.
Two details matter:
- Use unique visitors, not page views. One person who refreshes three times is one visitor. Page views inflate the denominator and shrink your rate.
- Define the conversion before you count. For a lead page it is a completed sign-up. For a sales page it is a paid order, not a click on the button. For a webinar registration page it is a registration, not an attendance.
Fifty sign-ups from a thousand unique visitors is 5 per cent. Fifty from four thousand is 1.25 per cent. Same work, very different page.
What the benchmark says
The most cited figure comes from Unbounce's Conversion Benchmark Report. The 2024 edition puts the median conversion rate across all industries at 6.6 per cent, drawn from more than 57 million landing page conversions. That is the whole of what you should take from it: a reference point from a very large sample.
What the figure is not: a pass mark. It is a median, which means half the pages in the sample converted better and half worse, across every industry and every kind of offer, from free checklists to expensive services. Your page is one page with one offer and one source of traffic.
Why a median can mislead you
Three reasons to hold the benchmark loosely:
- The offer sets the ceiling. A free checklist and a four-figure programme will never convert at the same rate, and should not. The checklist asks for an email; the programme asks for a decision.
- The traffic sets the floor. A page shown to people who searched for exactly what it offers will convert far better than the same page shown to a broad audience. A low rate often means the wrong visitors, not a bad page.
- The value per conversion changes the maths. A page at 2 per cent selling something worth a lot can be better business than a page at 10 per cent collecting emails that never buy. The report itself makes this point: its data counts conversion events, not the value of each one.
So compare your page with itself over time, and with your other pages, before you compare it with a global median.
How to measure your rate on Vonza
A funnel step
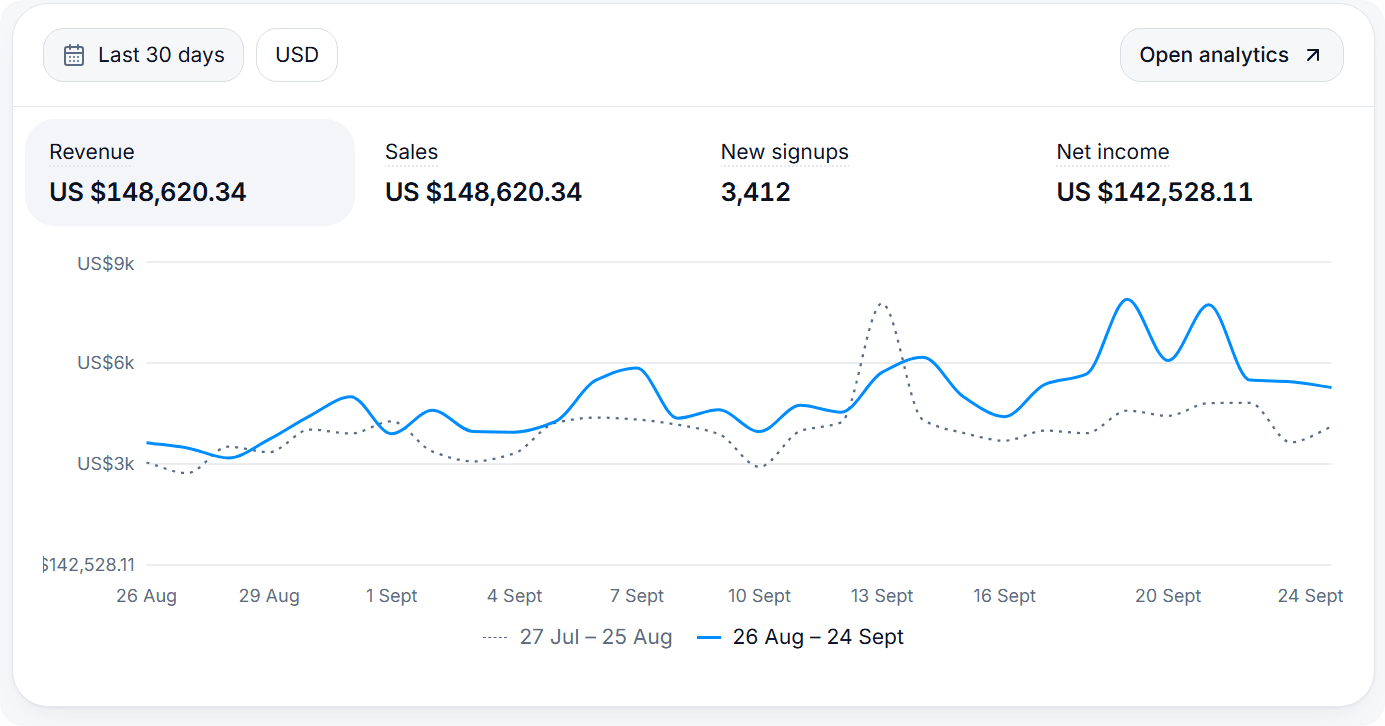
If the page is a step in a Vonza funnel, the rate is already counted. The funnel's Stats show page views, unique visitors, leads, orders, revenue and conversion for the last 7, 30 or 90 days, with a comparison to the previous period, and a step-by-step view that shows how many reached each step and where they dropped. Conversion there is defined as unique visitors who bought divided by unique visitors; for an opt-in step, read leads against unique visitors.
Stats also show sources (campaign, website, direct) and devices, so you can see whether a low rate belongs to one channel or to phones specifically.
A standalone landing page
A landing page built in the Vonza website builder is one page with a sign-up form. To measure it, add your Google tag and read visitors and conversions in Google Analytics, or send it through a funnel's opt-in step instead, which counts it for you. The landing pages page covers the builder.
What raises a conversion rate
In rough order of effect:
- Match the page to the promise. The headline should say what the ad or email said. A mismatch is the most common cause of a low rate and the cheapest to fix.
- Narrow the traffic. Send the page to the people the offer is for. A smaller, better-matched audience converts at a multiple of a broad one.
- Make the offer specific. "The 12-question client intake template" beats "free resources".
- Ask for less. Every form field costs you sign-ups. Email alone, plus a first name if you will use it.
- Fix the phone experience. Most visitors arrive on one. The button should be visible without scrolling; the form should be usable with a thumb.
- Use plain words and short paragraphs. Difficult words and long reading times lower conversions; the plainer version almost always wins.
- Show trust you can back. A real review, a real photo, a plain refund line. Never an invented one.
- Speed. Compress images, cut scripts you do not use.
The guide to landing page optimization goes through each of these with examples.
Testing a change
Once the obvious fixes are in, do not guess: test. On Vonza, split tests are a feature of funnel steps. Build the page as the opt-in step of a funnel, add a second version with one change, set the traffic share (1 to 99 per cent to each), and let the step count opt-ins for each version. Pick winner keeps the better one for everyone. The guide to split-testing a funnel step covers the set-up, and the A/B test calculator tells you whether a difference is likely to be real or just noise.
Standalone landing pages in the website builder do not have split tests, which is one reason to build a page you intend to improve as a funnel step.
The rate is one number in a chain
A landing page rarely stands alone. In a funnel, the opt-in rate, the checkout rate and the upsell rate multiply. Doubling the first one doubles everything after it; a few points on the checkout rate can matter as much. The funnel conversion calculator lets you put your step rates in and see what a change at one step does to the total, which is a better use of ten minutes than comparing your page with a global median.
A worked example
A tutor runs ads to a page offering a free "exam week study plan". Stats show a low rate from about a thousand unique visitors. The ad says "exam week study plan for GCSE students"; the headline says "Free study resources". She changes the headline to match the ad, cuts the form from three fields to one, and runs it as a split test on the opt-in step for two weeks. The matched version wins clearly; she picks it, then tests the freebie itself next. The numbers here are made up to show the method; they are not results.
Open Funnels or the website builder, write down your current rate, and change one thing. New to Vonza? Start a 14-day free trial from the landing pages page, or read the guide to the best landing page builders if you are still choosing a tool.